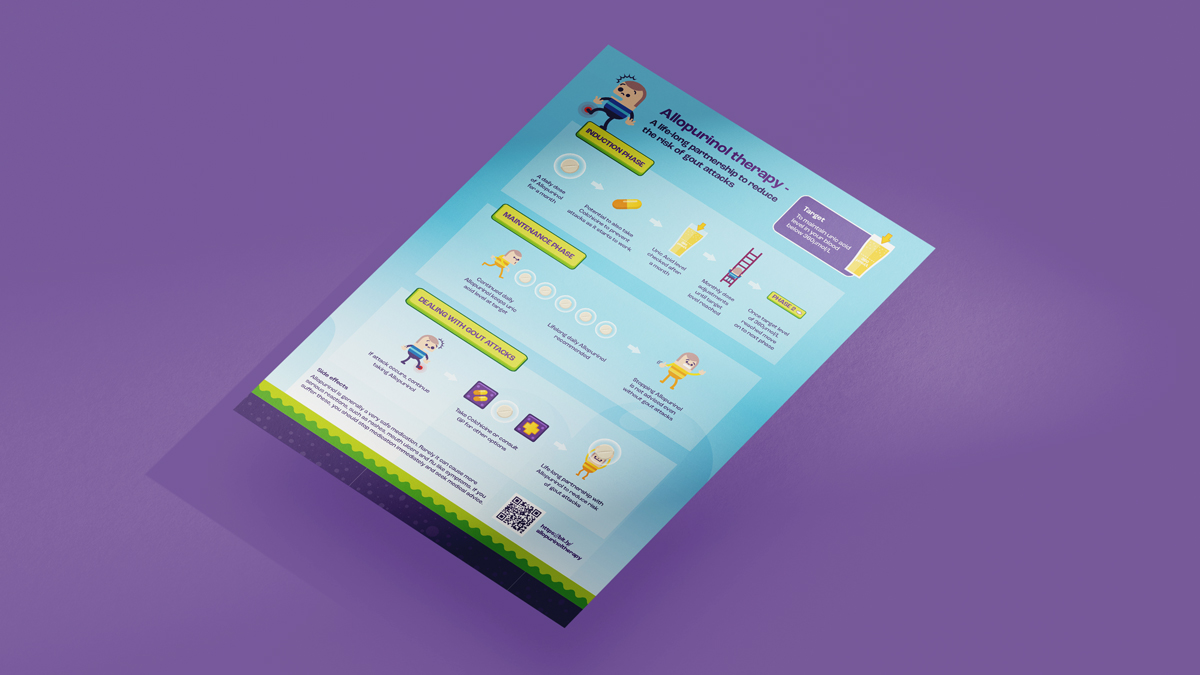
Along with an animation we developed for St George’s University Hospitals, this medical process infographic guides gout patients in understanding the importance of a consistent and ongoing treatment plan.
Background
Since its establishment in the mid 18th century, St George’s Hospital has prioritised community and patient care. With a strong track record in research, education and medical advancements, St George’s, alongside Queen Mary’s Hospital, now forms a 9,000-strong NHS Foundation Trust, serving a population of 1.3 million in South West London.
Challenge
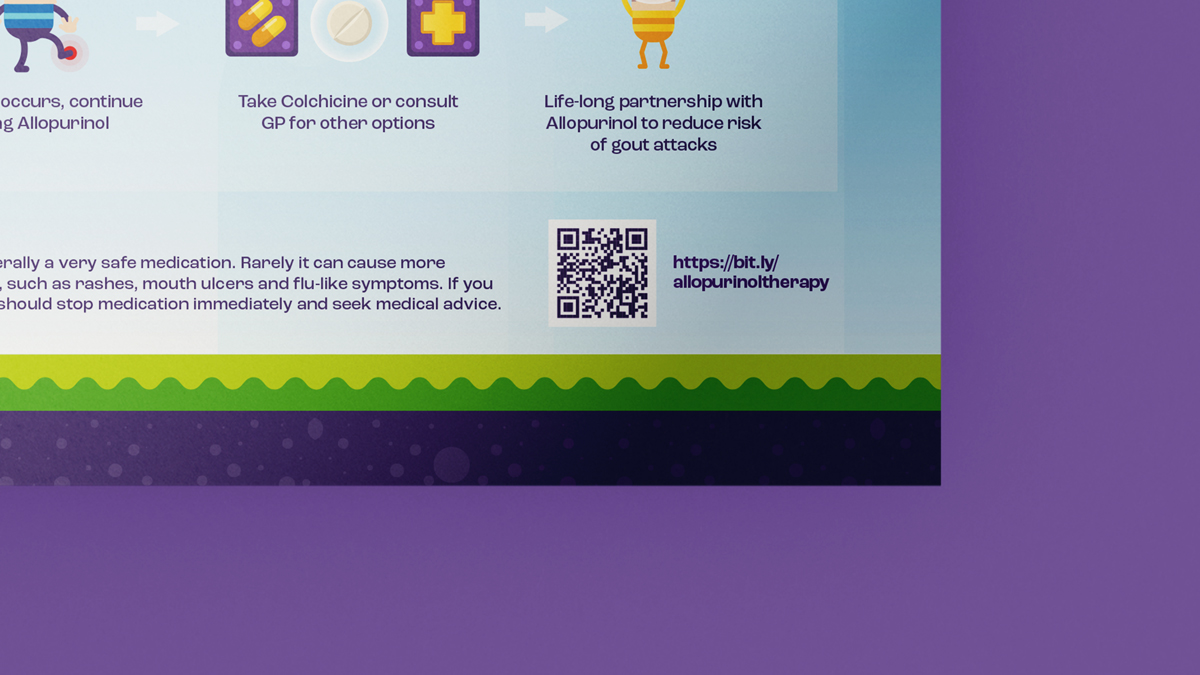
Our task was to create an infographic design that would help educate patients on the importance of starting and staying on Allopurinol treatment for gout, a condition that affects 1 in 40 people in the UK. Many patients discontinue treatment too soon, some due to frustration over the slow onset of effectiveness, while others, experiencing symptom relief, assume they no longer needed medication. In reality, gout is a lifelong condition that requires ongoing monitoring and treatment.
Recognising that traditional patient information sheets and face-to-face consultations were not achieving the desired results, our client sought a more engaging and effective approach. The infographic format was chosen as a clear, visual and accessible way to improve patient understanding and adherence to Allopurinol, ensuring better long-term management of the condition.
Solution
To address the challenge, we developed a medical process infographic designed to serve as an effective educational tool for gout patients. This infographic complemented the animation we had previously created for our client, ensuring a cohesive and engaging approach to patient education.
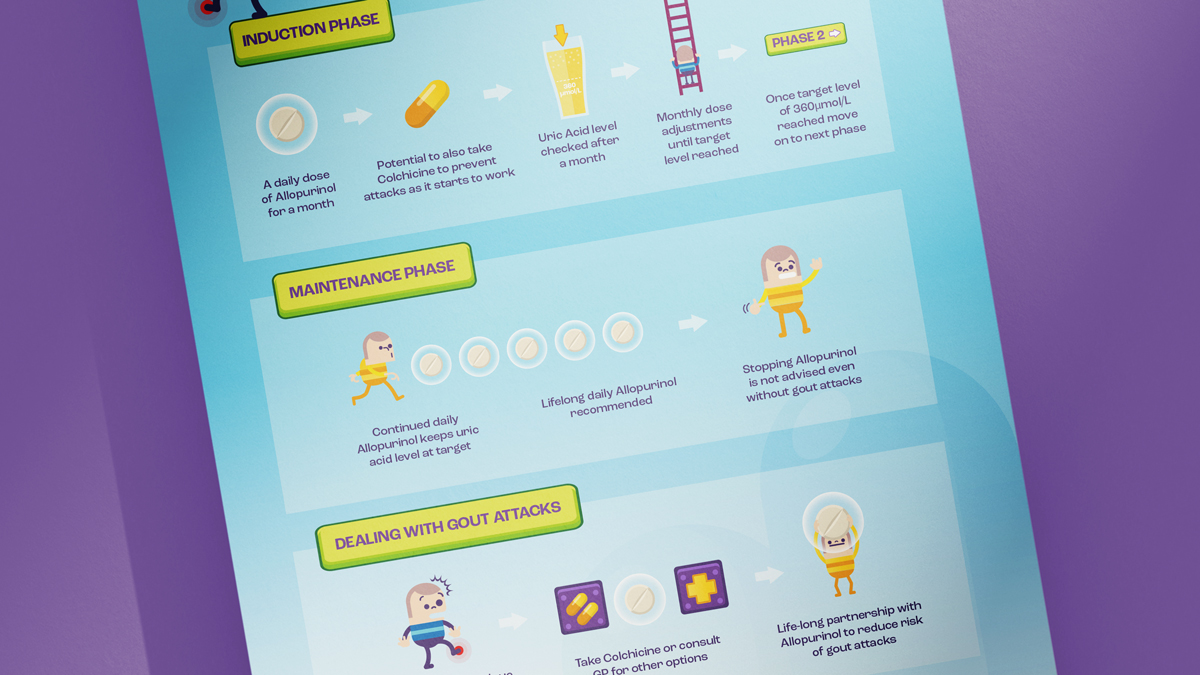
Rather than attempting to replicate the full animation storyboard within a static infographic, we focused on distilling the information into clear, digestible stages. Each stage was illustrated using engaging visuals that matched the fun and energising style of the animation, creating a seamless visual experience across both formats.
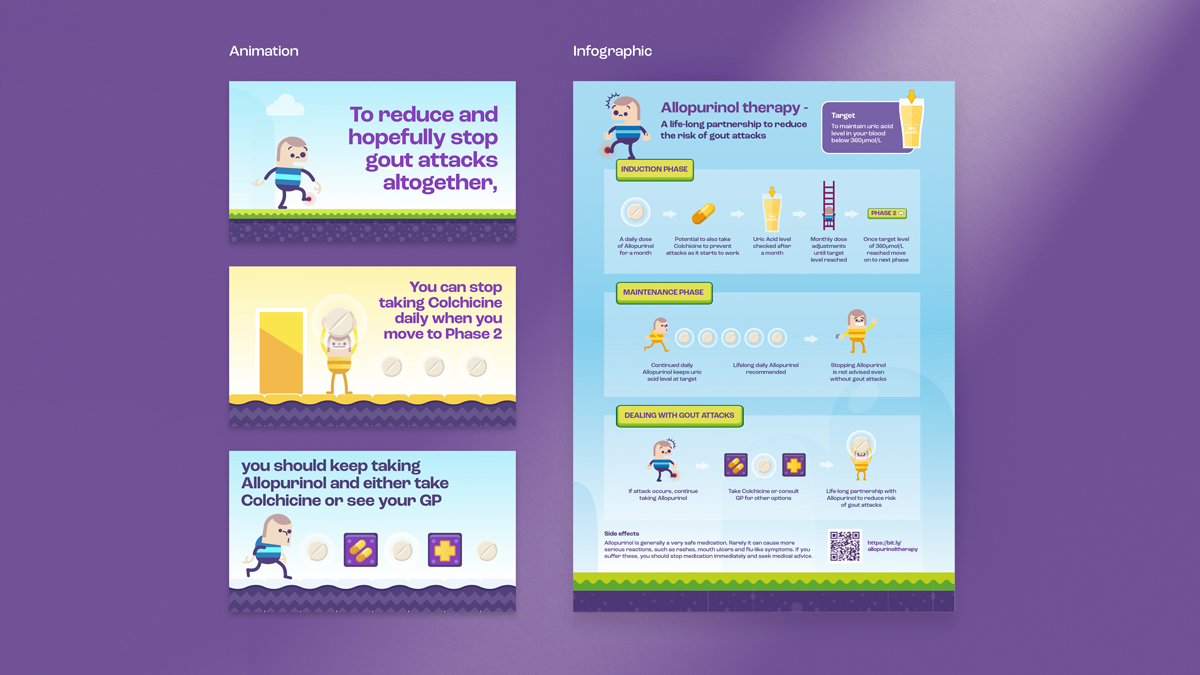
To further enhance usability and encourage patients to explore additional resources, we included a QR code at the bottom of the infographic. Scanning the code instantly links patients to the animation, providing an interactive and accessible way to reinforce their understanding of the treatment process.
“The team at Parker were fantastic – extremely responsive, professional and a pleasure to work with. A special thanks to Helen for her tireless effort to create a product we are extremely happy with! Thank you so much again for all your help!” – Professor Patrick Kiely, Consultant Rheumatologist, St George’s Hospital, London
Take a look at the animation to see the process come to life.
Looking for help with your project?
Feel free to give us a call to start a conversation,
our doors are always open.
Related projects

Deloitte
Internal communications infographic

H&T Presspart
Medical device animation

LEO Pharma
Pharmaceutical stand
