This economic report design clearly communicates the impact of research and innovation on regional growth. Using structured data, visuals and case studies, it highlights measurable outcomes and the link between investment in innovation and economic progress, ensuring accessibility and engagement.
Background
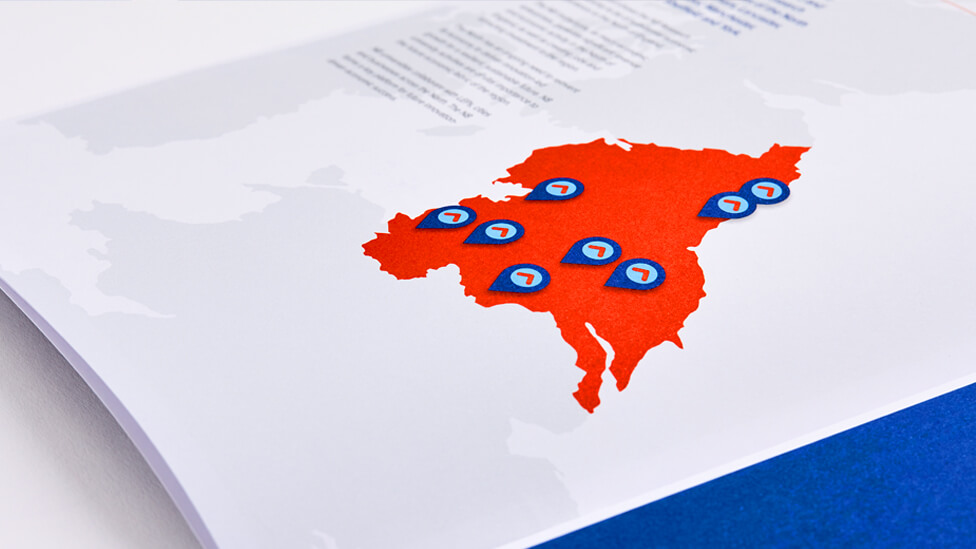
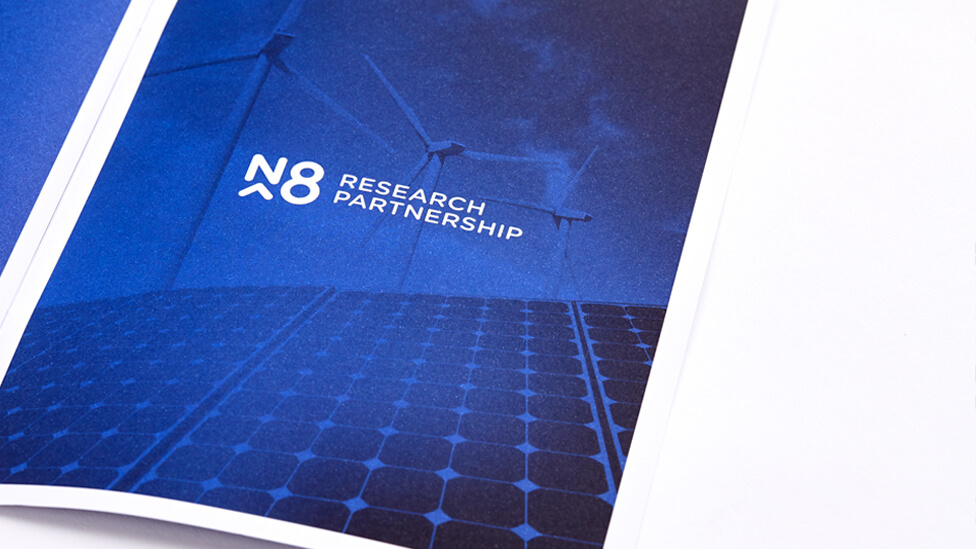
The N8 Research Partnership is a key contributor to the Northern Powerhouse, a government initiative focused on driving economic growth in the North of England. Formed by the eight leading research-intensive universities in the region, the partnership is dedicated to strengthening collaboration between academia, industry and society. Its primary goal is to harness research excellence and transform findings into practical benefits that support regional development both now and in the future.
For an initiative of this scale to succeed and thrive long-term, effective communication is essential. Clear, open and transparent reporting on progress and outcomes ensures that stakeholders remain engaged and aligned, reinforcing the spirit of collaboration that underpins the partnership’s mission.
Challenge
Our client needed an economic report design that went beyond presenting data: it had to foster meaningful dialogue between universities and stakeholders. The design needed to capture complex economic insights in a clear and engaging way, encouraging stronger engagement and reinforcing long-term commitment from all involved. It was essential to strike the right balance between visual appeal and informative depth to ensure the report resonated with the audience.
Solution
The economic report design transforms complex data into a visually engaging and structured booklet, ensuring that key insights are clear, accessible and easy to understand. By combining thoughtful layouts, compelling visuals and well-organised content, the design makes extensive economic and research data more digestible for a diverse audience. It balances clarity with depth, presenting information in a way that captures attention while maintaining accuracy and credibility. This approach not only enhances readability but also strengthens the impact of the report, making it a valuable resource for stakeholders seeking to understand the broader implications of research and innovation on economic growth.
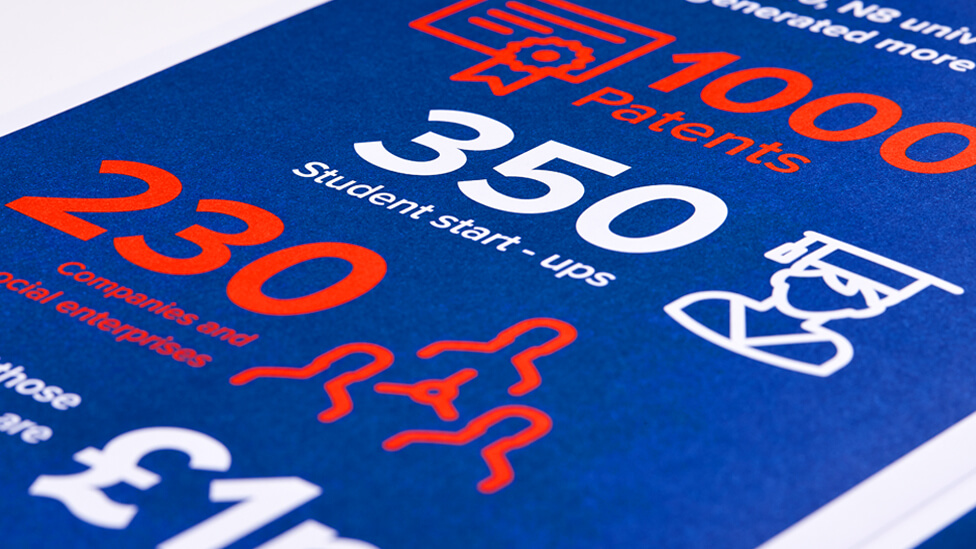
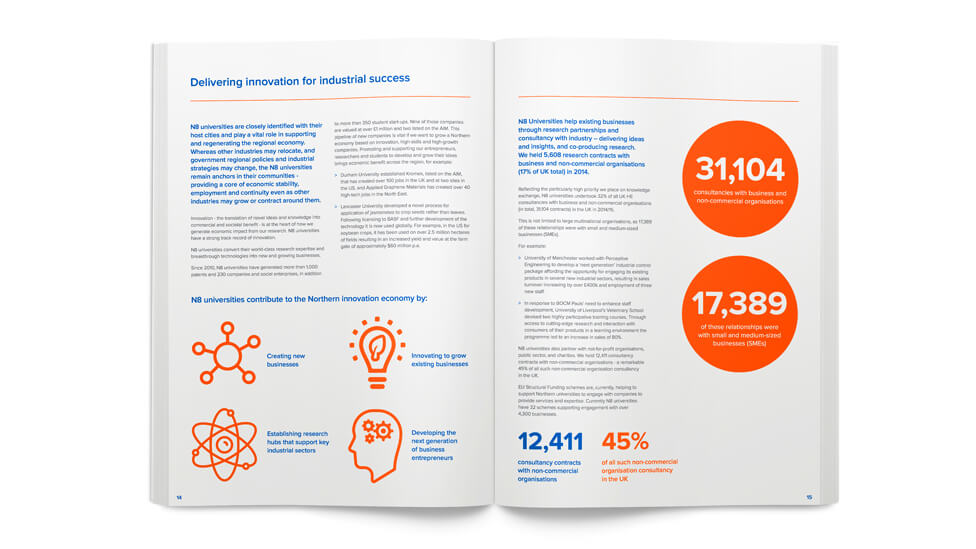
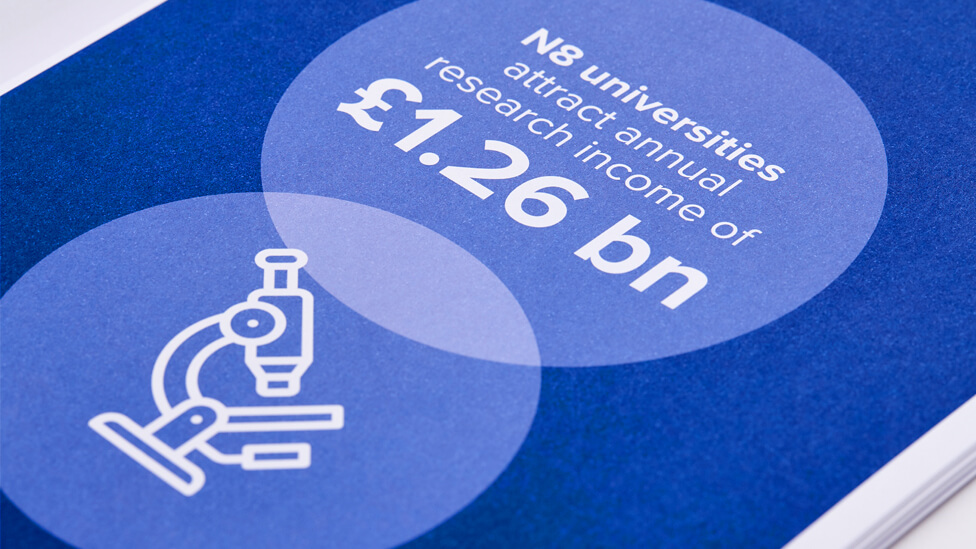
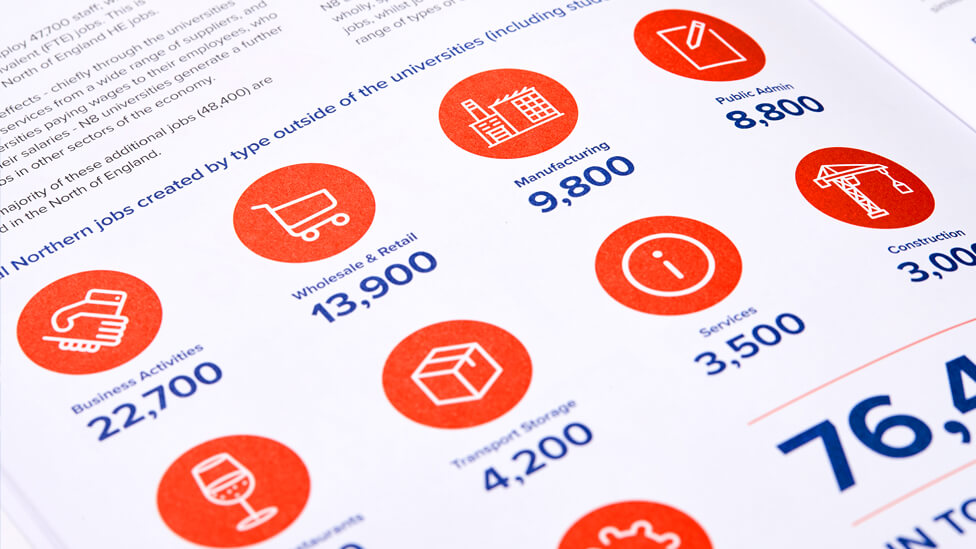
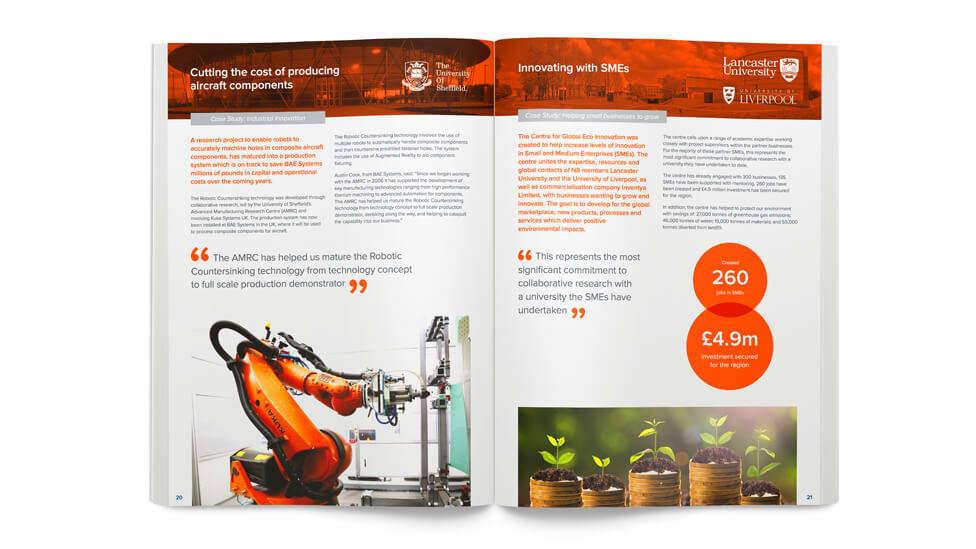
To boost readability and engagement, we structured the content into two distinct sections, each serving a specific purpose. The first section prioritises key statistics, using a clean and minimalistic approach to ensure that attention remains focused on the data. By limiting imagery, we maintained clarity, allowing the numbers to take centre stage. Colour was strategically applied only to highlight data points, reinforcing a clear visual hierarchy that guides readers through the information effortlessly. This intentional design choice makes complex statistics easier to interpret at a glance, ensuring that readers can quickly grasp essential insights within the broader economic context.
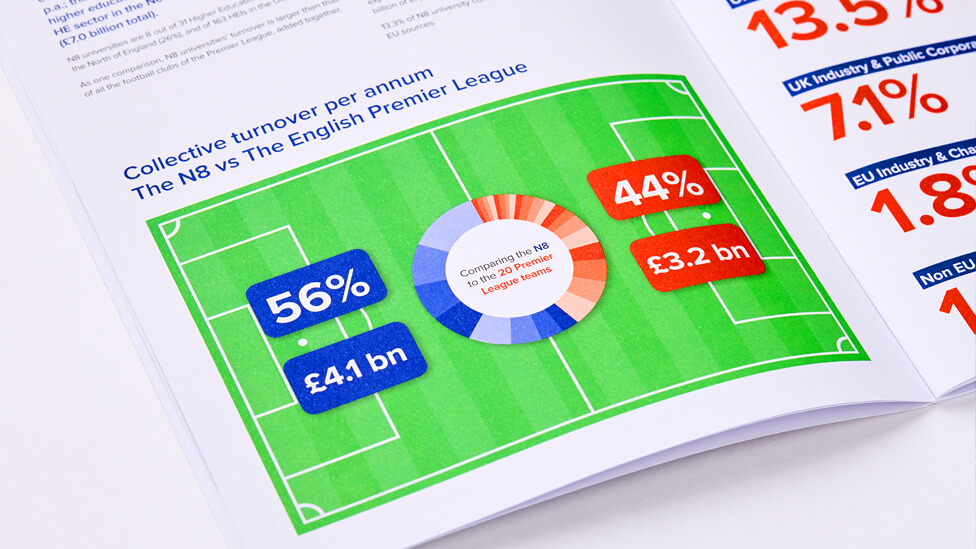
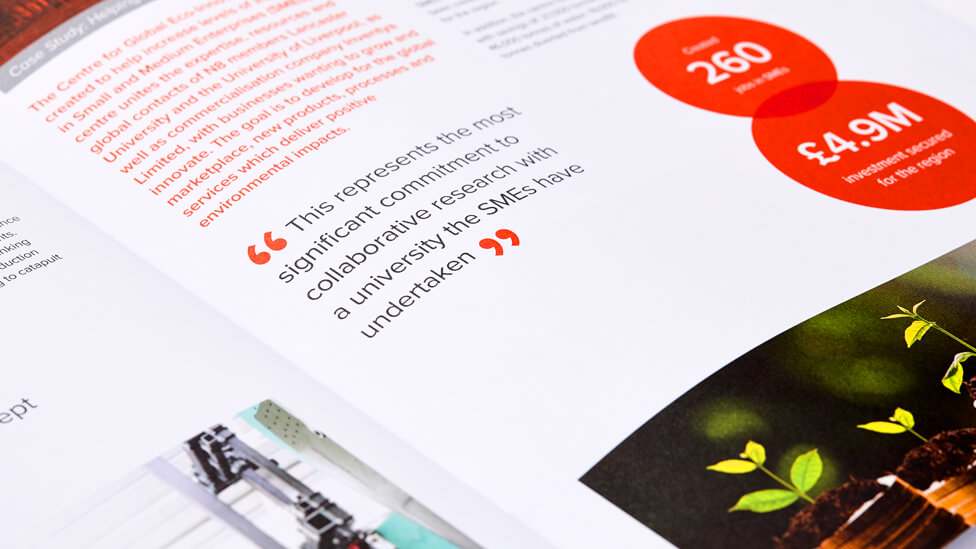
Always with memorability in mind, we integrated infographic-style illustrations to transform key data into visually compelling elements. These graphics serve as more than just decorative additions, they play a crucial role in reinforcing complex information in a way that is both engaging and easy to recall. By translating data into clear, structured visuals, we ensured that the report remains accessible to a wide audience while making key insights more intuitive. This approach not only enhances engagement but also increases retention, allowing readers to absorb and remember essential information long after they have viewed the report.
The second half of the economic report transitions to a more narrative-driven format, bringing the impact of research to life through compelling storytelling. It features detailed case studies from each N8 university, offering in-depth insights into their contributions to innovation and economic growth. This section adopts a magazine-style layout, incorporating engaging articles, first-hand testimonials and vibrant photography to illustrate the tangible outcomes of N8’s research efforts. By highlighting individual success stories and real-world applications, the report goes beyond statistics, demonstrating how collaborative research is actively shaping regional development and strengthening connections between academia, industry and policymakers.
The report was formally launched to a distinguished audience that included industry leaders, business executives, university representatives, policymakers, government officials and funding bodies. Its release carried significant weight, as it came just two months after the EU Referendum results, a period of uncertainty for UK research funding. At the time, approximately 13% (£127 million) of competitive research funding for N8 universities originated from the European Union, highlighting the urgency of addressing future investment challenges.
To further extend the reach and impact of the report, we adapted elements of the economic report design into dynamic animated infographics, optimised for use across our client’s website and social media. This strategic repurposing transformed key data points into visually engaging, shareable content, increasing accessibility for a wider audience. By leveraging motion graphics, we ensured that complex information was not only easy to digest but also more compelling in digital formats. This cost-effective approach empowered the client’s internal team to distribute insights interactively, maximising visibility, engagement and awareness while reinforcing the report’s core messages across multiple communication channels.
Looking for help with your project?
Feel free to give us a call to start a conversation,
our doors are always open.
Related projects

EITI
Multilingual report design

Dee Valley Water
Corporate report design

IFoA
Digital performance report
