We helped our client mark 160 years in business by designing an interactive infographic design that invited customers to engage with their story.
Background
The Shipowners’ Club, one of just 13 insurers covering over 90% of the world’s ocean-going tonnage, serves a diverse and loyal global client base. Proud of their history and excited for the future, they wanted to celebrate a major milestone – 160 years in business – and asked us to help them commemorate their achievements.
Challenge
Our client commissioned an interactive infographic to serve as a responsive feature on the Shipowners’ website, designed to engage visitors with an immersive experience. It would also be included in an email campaign, ensuring wider participation in the anniversary celebrations.
Solution
Having previously collaborated with The Shipowners’ Club on the design and development of their website, we were already familiar with the vast amount of information that needed to be incorporated into the infographic. This insight allowed us to create an interactive infographic design that guided users through the company’s long history, celebrating milestones and achievements while also offering a look into an exciting future.
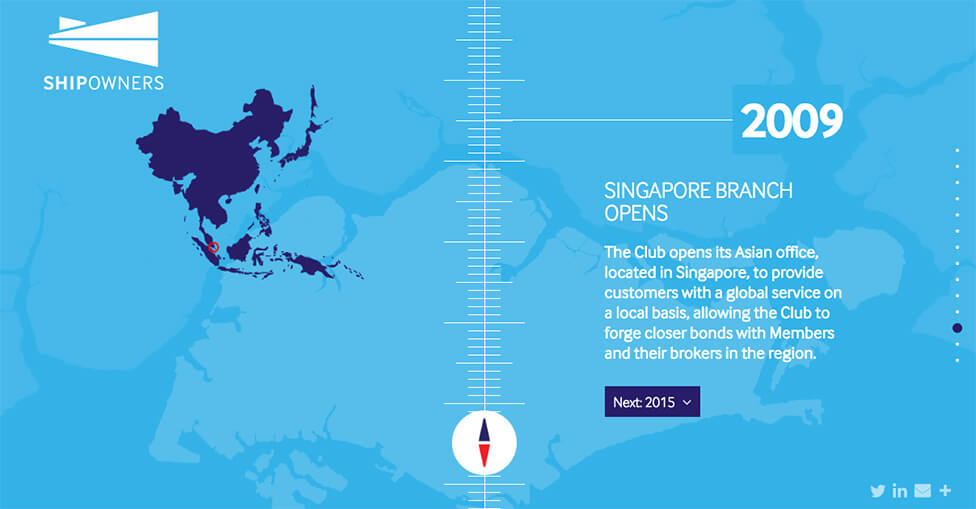
To enhance the timeline experience, we integrated fullpage.js functionality, enabling full-screen, multi-directional scrolling. This feature aligned seamlessly with the timeline format, adding an element of fun, movement and journey customisation. Users could navigate through The Shipowners’ Club’s history effortlessly using their mouse or keyboard, making the experience both engaging and intuitive.
The infographic was structured into easy-to-digest sections, ensuring that even a rich historical narrative remained clear and accessible. We reinforced each historic achievement with archival images from The Shipowners’ collection, offering an authentic glimpse into the company’s past. To further elevate the storytelling, we incorporated nautical-inspired graphic elements, helping viewers plot their journey through the timeline. The fully responsive design ensured seamless functionality across all devices, providing users with an immersive experience whether they accessed it on desktop, tablet or mobile.
Over the years we have helped clients of all shapes and sizes engage audiences through the power of infographics. Have a look at our dedicated infographic design page to find out more.
Looking for help with your project?
Feel free to give us a call to start a conversation,
our doors are always open.
Related projects

Deloitte
Internal communications infographic

Andrews Sykes Group
Animated infographic design

The University of Sheffield
Multilingual infographic design
