These informative pharma infographics help educate clinicians and healthcare companies on ways to collaborate to achieve better patient outcomes.
Background
The Association of the British Pharmaceutical Industry (ABPI) represents the UK’s biopharmaceutical sector and its interests. Ahead of a key industry event, the organisation aimed to emphasise the crucial role that healthcare professionals and life sciences businesses play in the development of new medicines and treatments.
Challenge
Our client required a persuasive educational resource that could be easily shared, emphasising the importance of collaboration between clinicians and healthcare companies to improve patient outcomes. The goal was to create a versatile resource that could be used in various formats, ensuring maximum reach and impact.
Solution
We developed a set of pharma infographics to provide our client with a flexible and engaging way to communicate their key message across different platforms.
To maintain brand consistency, we selected a colour palette inspired by ABPI’s logo, reinforcing their visual identity while keeping the design modern and professional. The infographics were designed to be clear, informative and visually appealing, making them ideal for digital sharing. The format was also easily adaptable for print, allowing the infographic to be handed out at medical conferences.
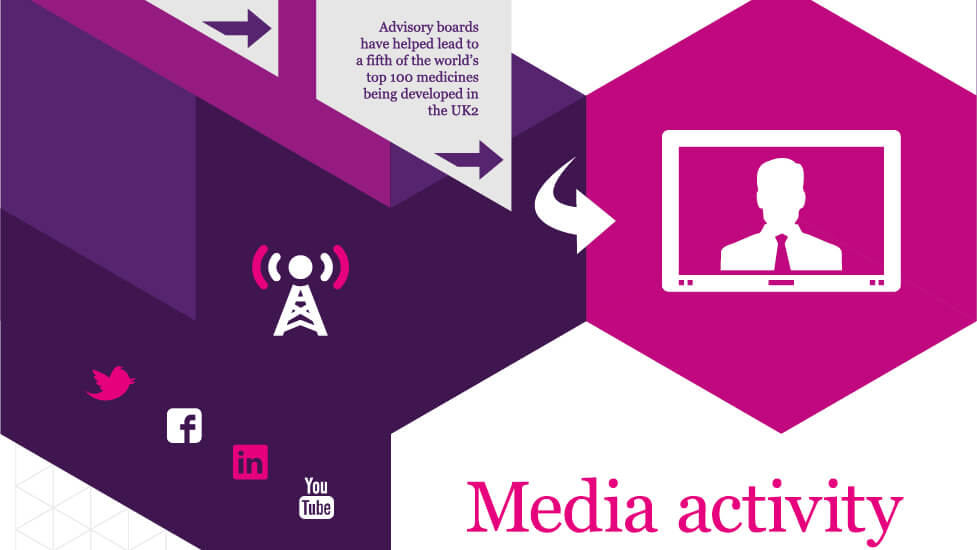
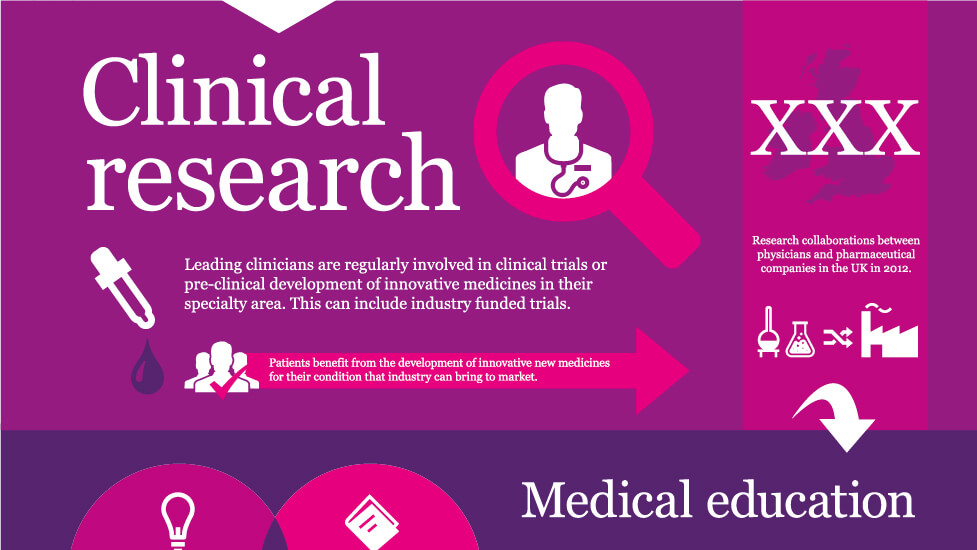
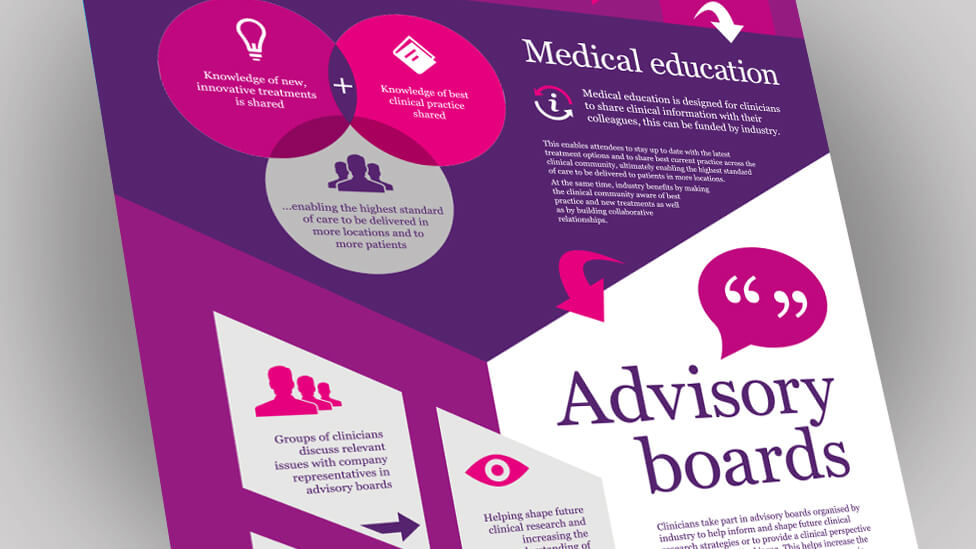
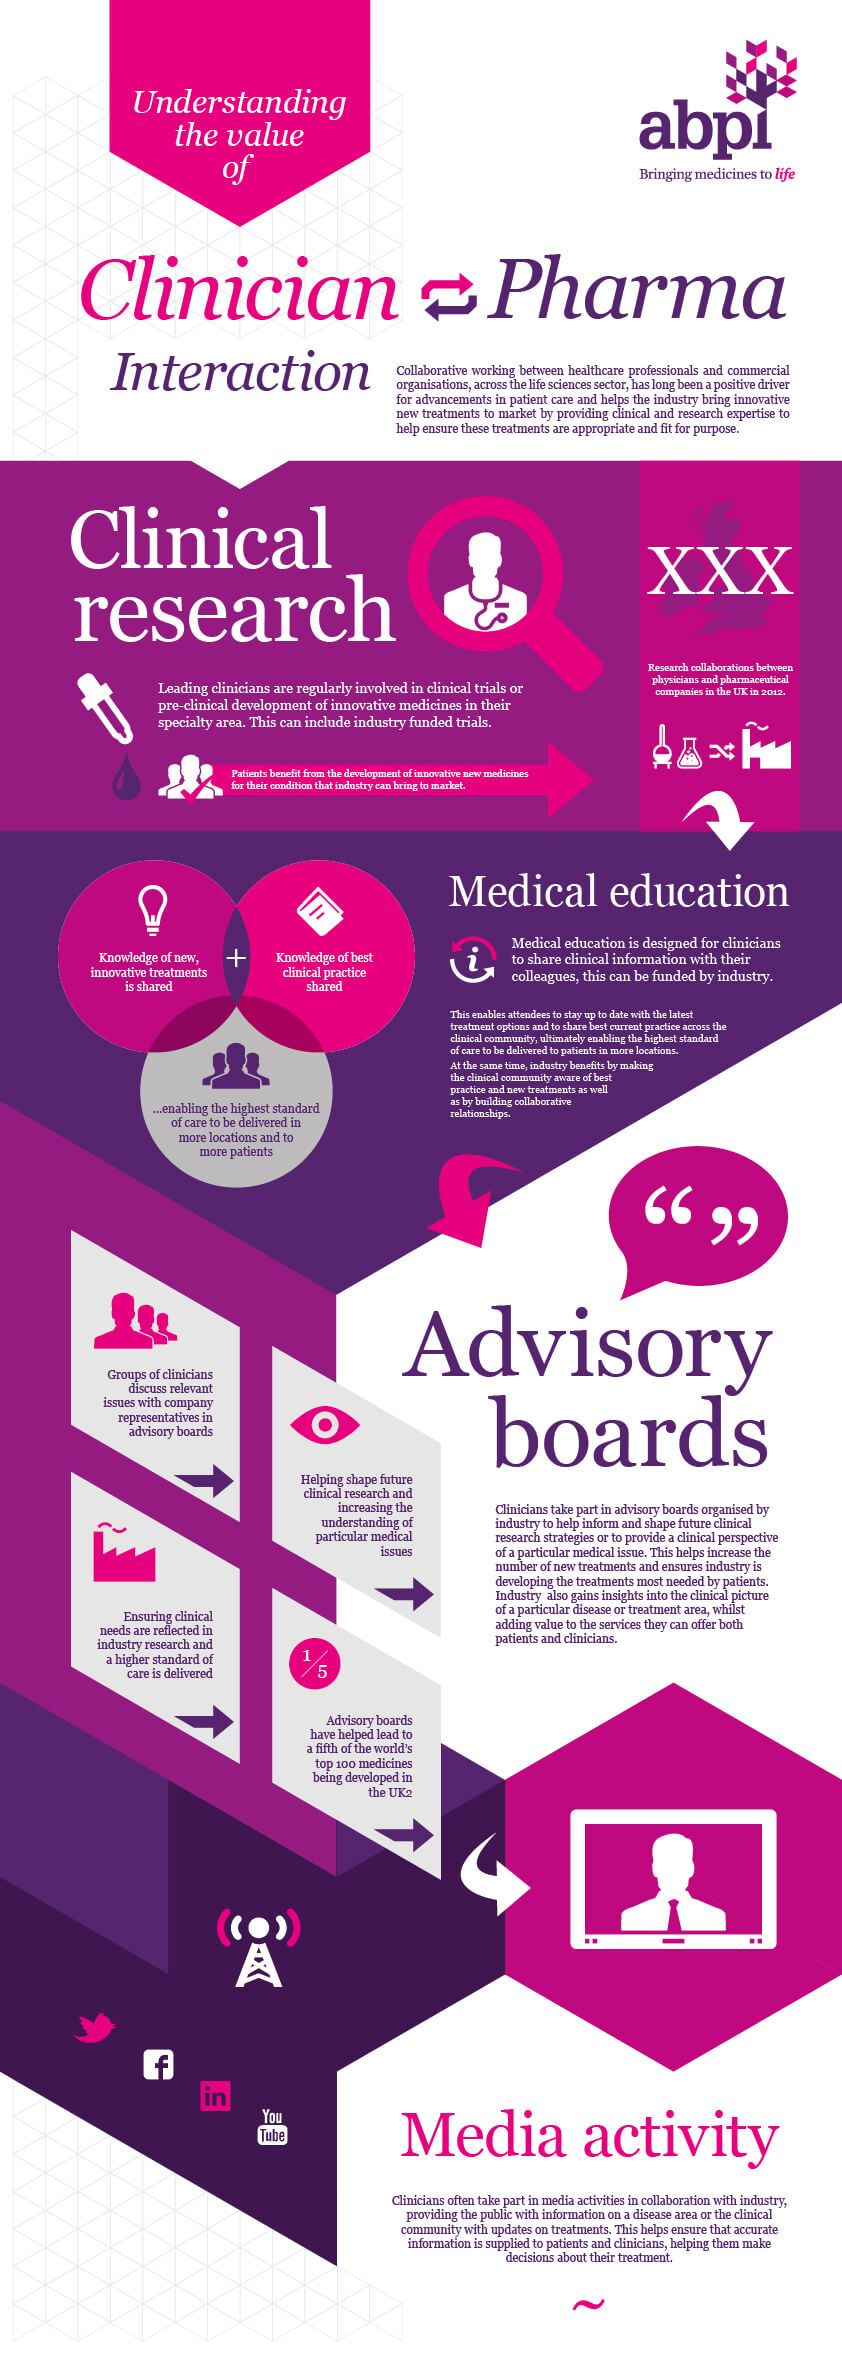
The pharmaceutical infographic design presents four key areas – clinical research, medical education, advisory boards and media activity – to clearly illustrate how clinicians and pharmaceutical companies collaborate throughout the drug development process. Each section explains the specific roles and contributions of both parties, making the information easy to follow and engaging for the target audience.
By breaking down the complexities of drug development into distinct focus areas, the infographic helps healthcare professionals and industry stakeholders understand the interdependencies within the process. The structured layout delivers a concise yet informative summary while drawing attention to critical development areas that interest the audience.
The infographic received a highly positive response and became a widely used educational resource at multiple industry events. Its clear structure and visually engaging format made it an effective tool for presentations, discussions and training sessions at these events. It was also repurposed as blog and social media content.
Highlights
- The pharma infographics use simplified visuals and a bright colour palette to balance a large amount of text, making the content easier to digest.
- Geometric elements inspired by the client’s logo add a modern and cohesive look, subtly reinforcing brand recognition while enhancing the overall design.
- To improve clarity, we incorporated simple icons that highlight key data points for clinicians. These visual cues help guide them through the collaboration process, making complex information more accessible and actionable.
Over the years we have helped a wide range of clients communicate with audiences through engaging infographic design. Have a look here to find out more.
Looking for help with your project?
Feel free to give us a call to start a conversation,
our doors are always open.
Related projects

Dematic
Thought leadership infographics

AstraZeneca
Process infographic

HRonline
HR infographic design
