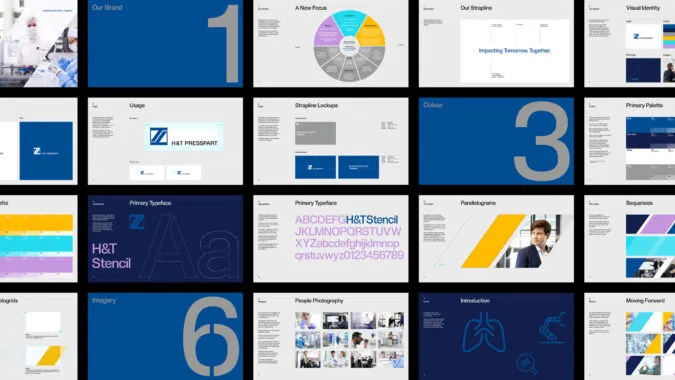
Infographic design
Visualising data
We can help you find the perfect way to visualise your data with infographic design. From explaining complex concepts and processes, to making research findings more digestible and easier to understand, we identify innovative ways to present your information quickly and clearly, allowing you to tell a coherent story that’s compelling, memorable and shareable.
By helping your audience see the context behind the data, infographics can help position you as an expert in your industry and provide high-quality content for presentations, reports, internal communications and a variety of social media platforms.
We create a wide range of infographic design solutions, including data-rich charts, animated infographics, timelines, pictographs, process diagrams, flowcharts and interactive infographics. As marketing tools, website content or an educational resource, infographics are a visually appealing way to simplify your message and trigger a greater sense of understanding and engagement with your audience.
Infographic design showcase
We specialise in creating infographics that do more than just visualise data. Our designs simplify the complex, guide the eye with purposeful structure and capture attention through clear, compelling storytelling.
Every infographic we create is a considered blend of strategy and creativity, designed to reflect your brand, connect with your audience and support your communication goals. From initial concept to final output, we make sure every detail contributes to a clear, engaging and effective result.
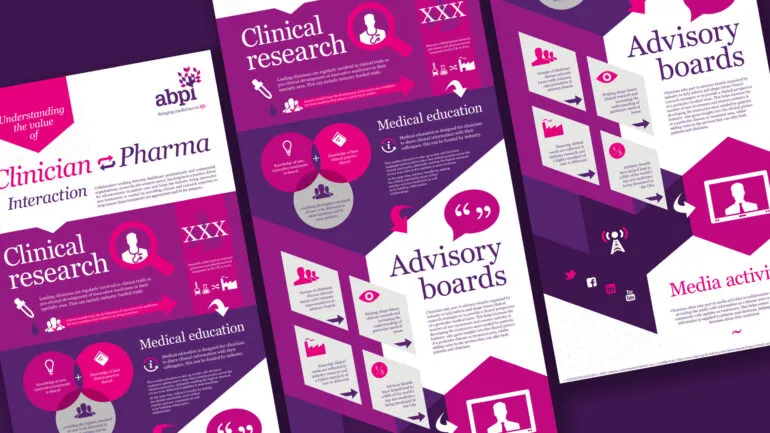
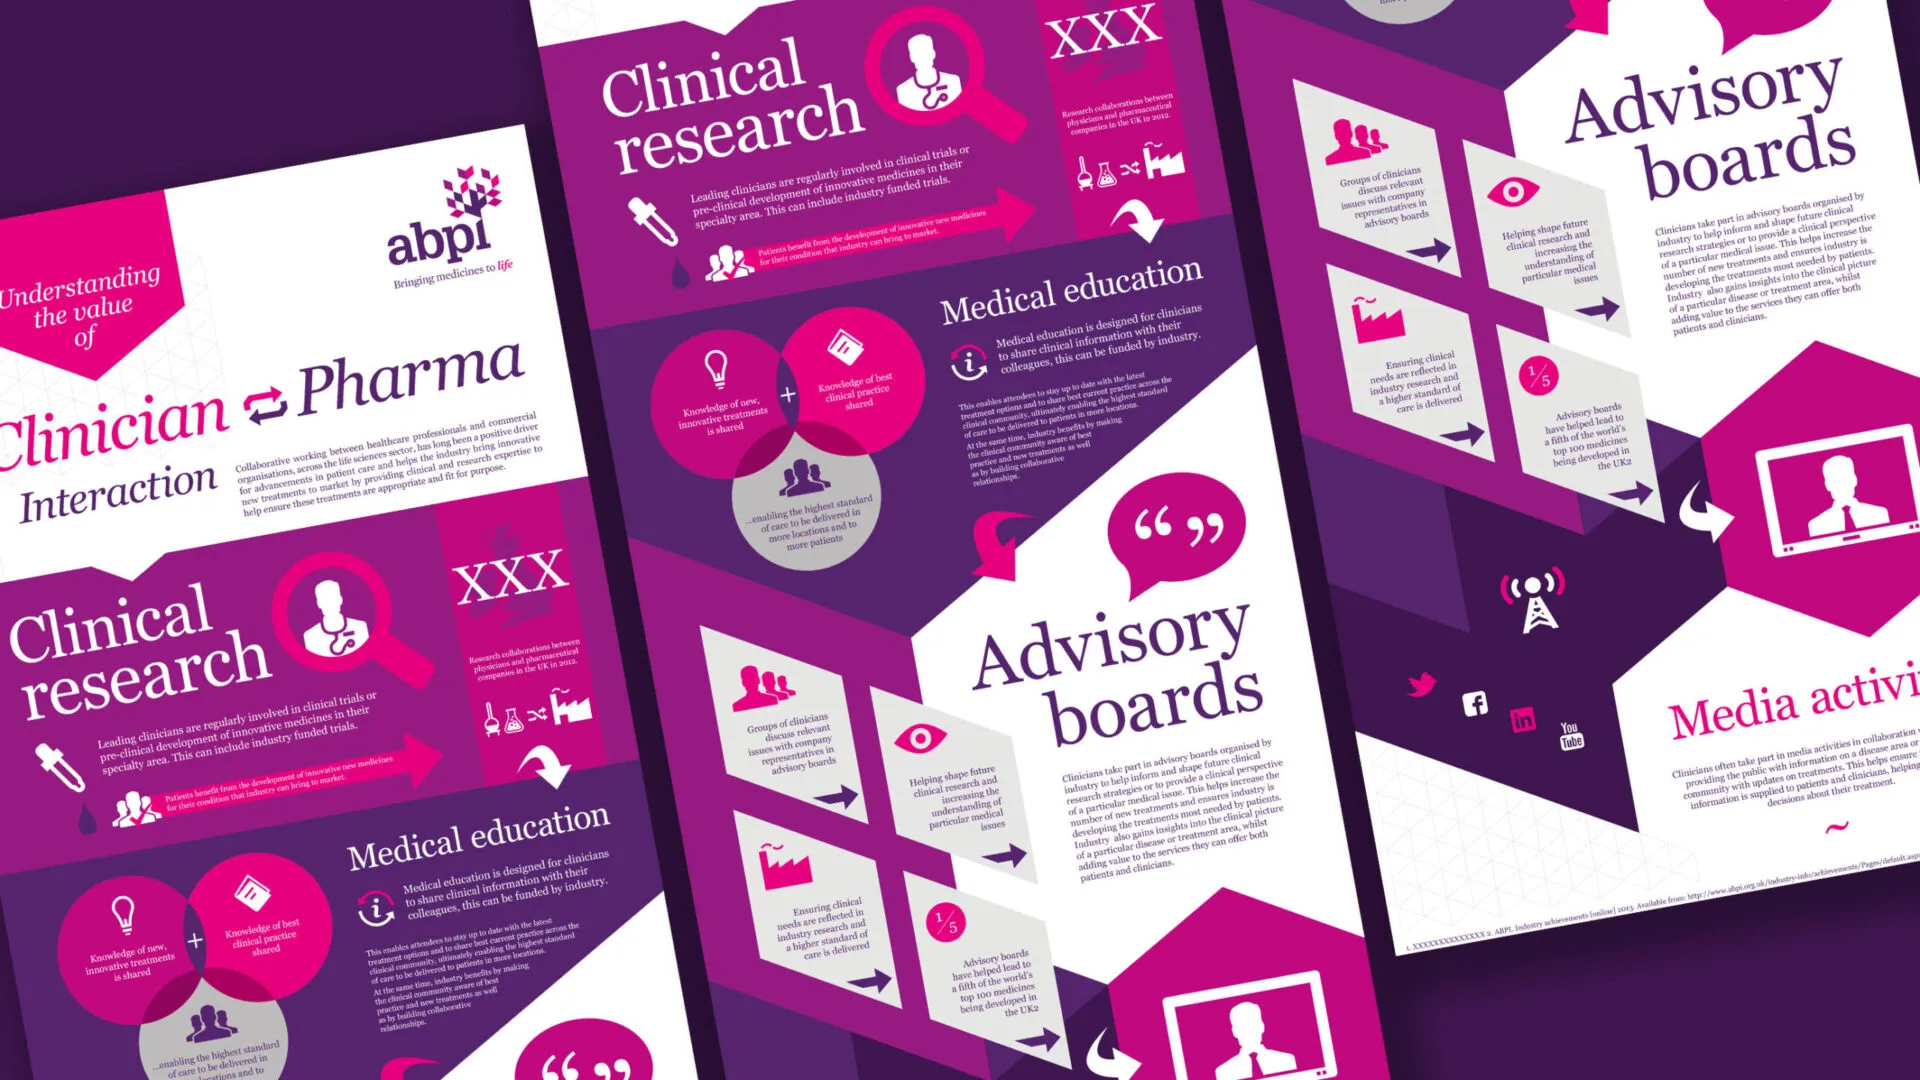
ABPI
Pharma infographics
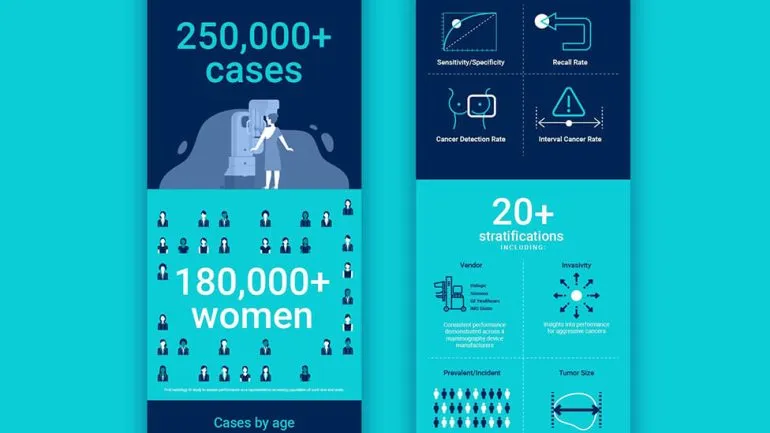
Kheiron Medical
Medical infographic design
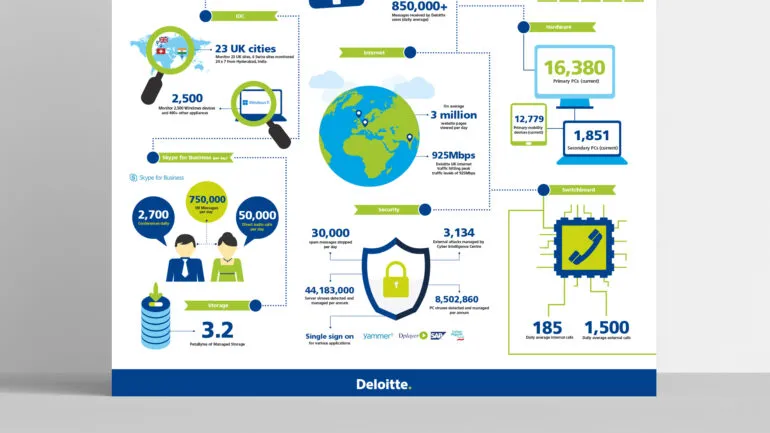
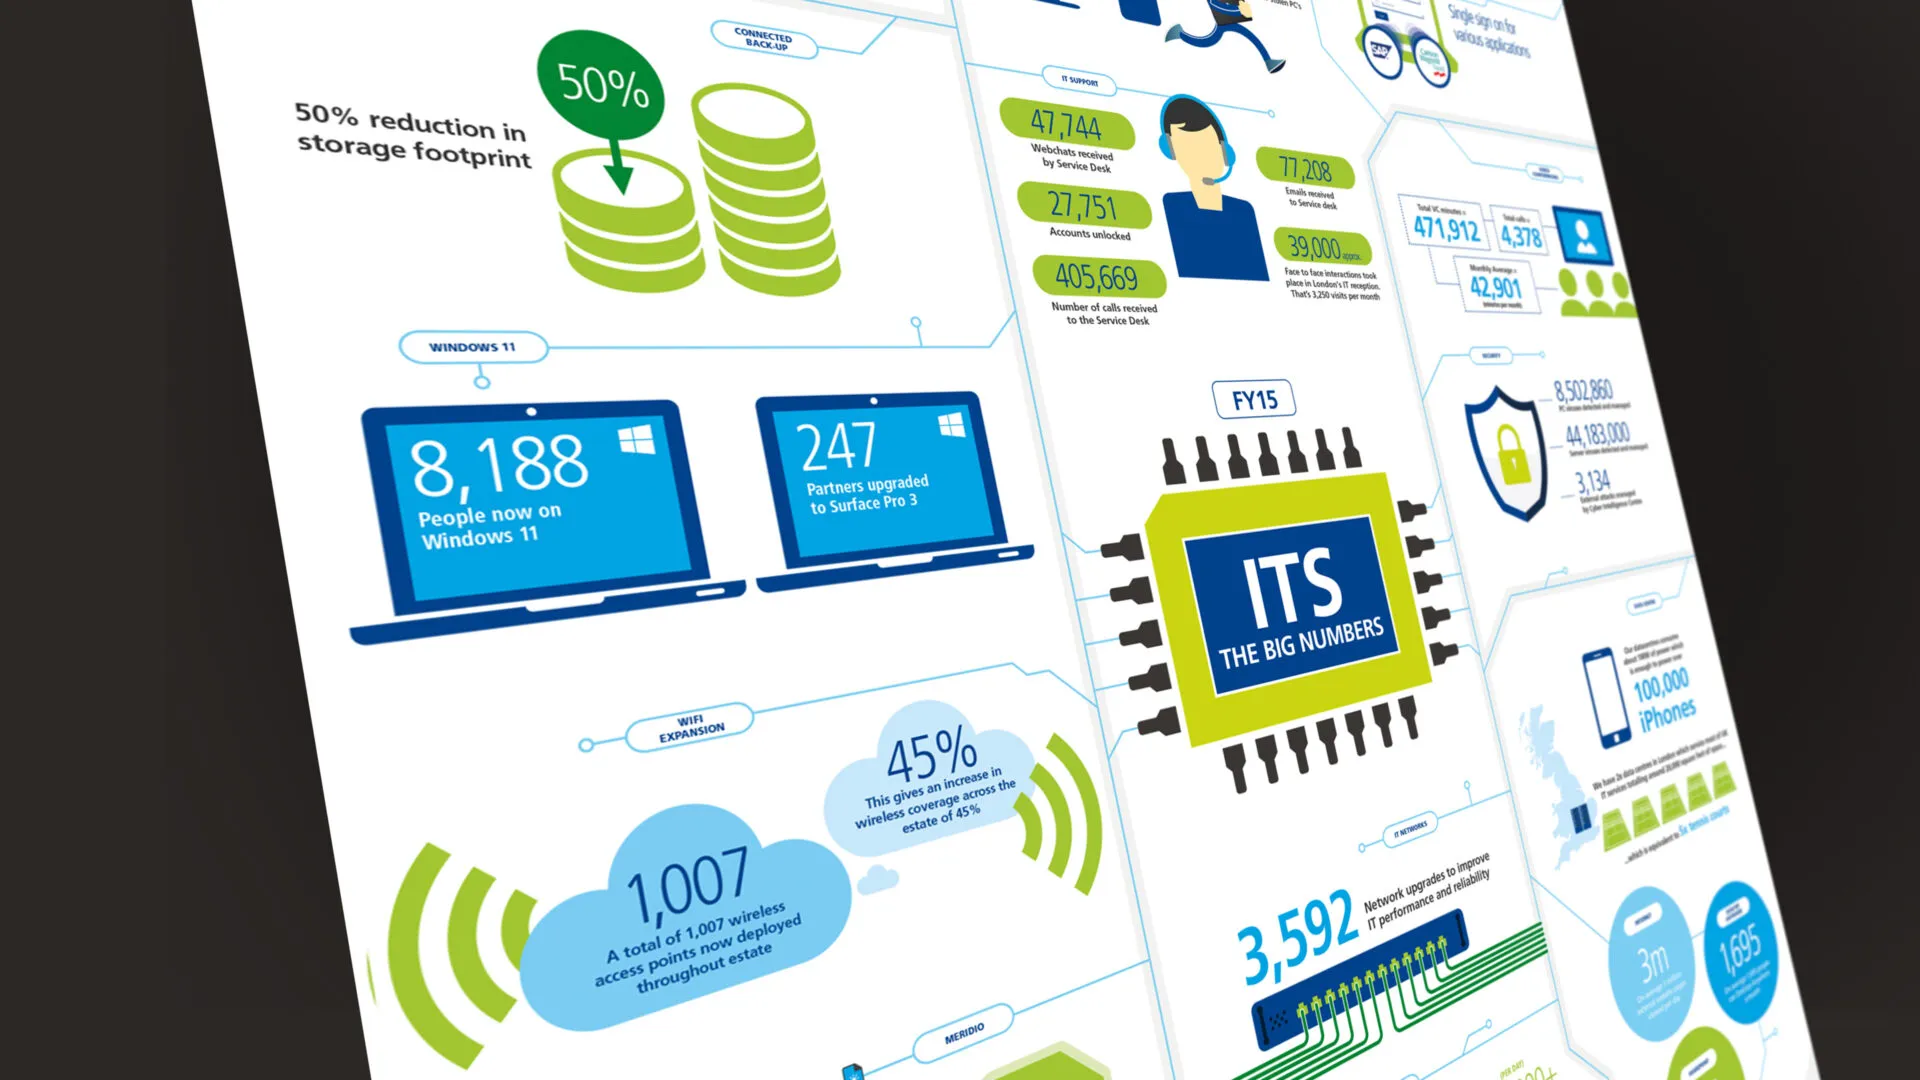
Deloitte
Internal communications infographic
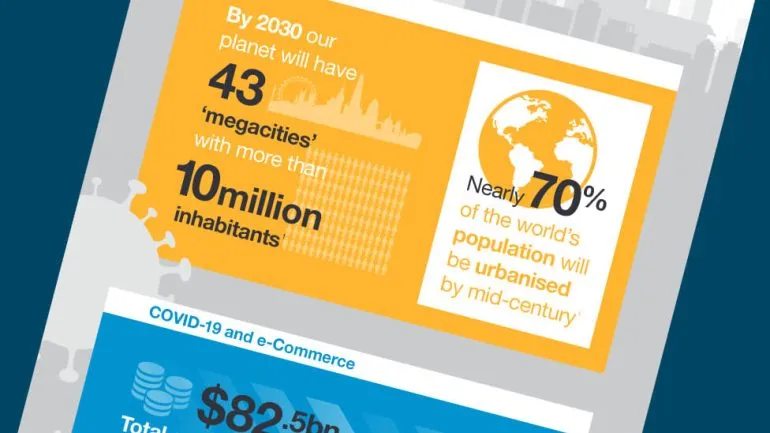
Dematic
Ecommerce infographics
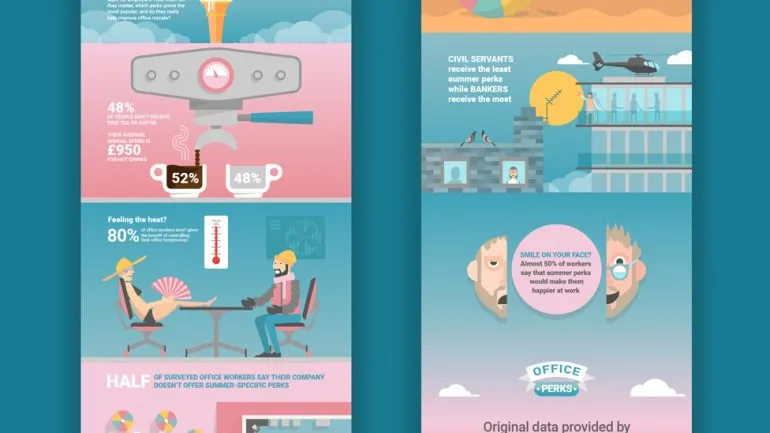
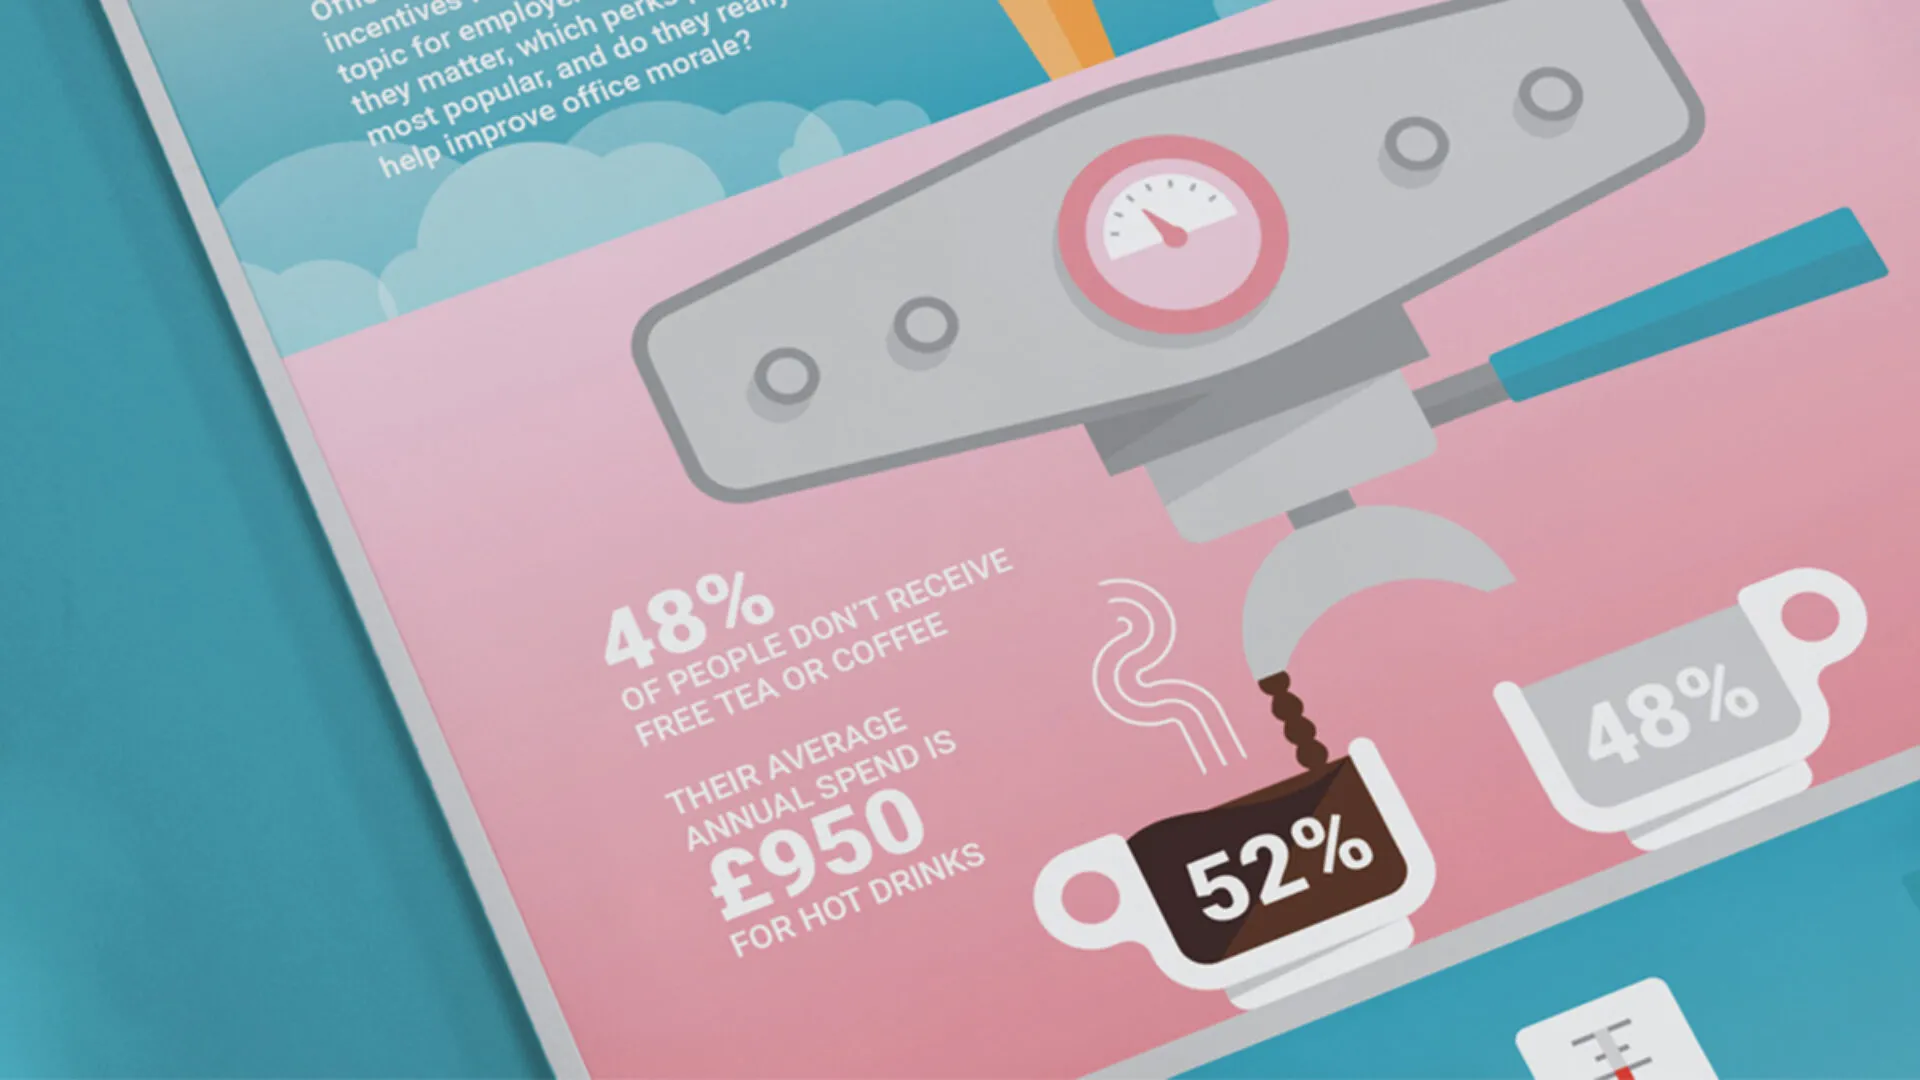
Andrews Sykes Group
Social media infographic
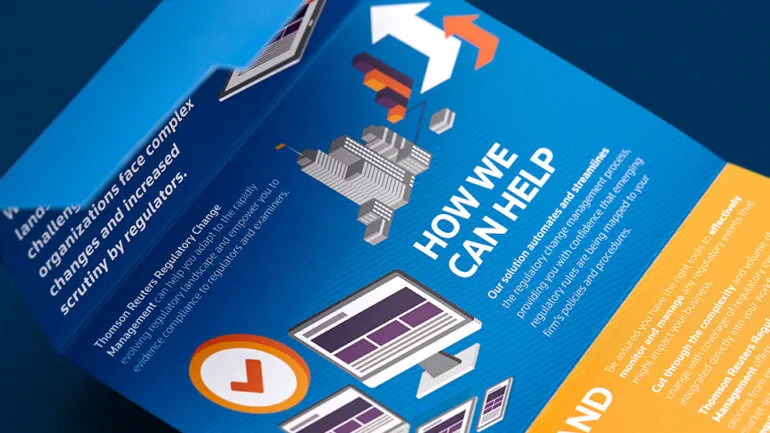
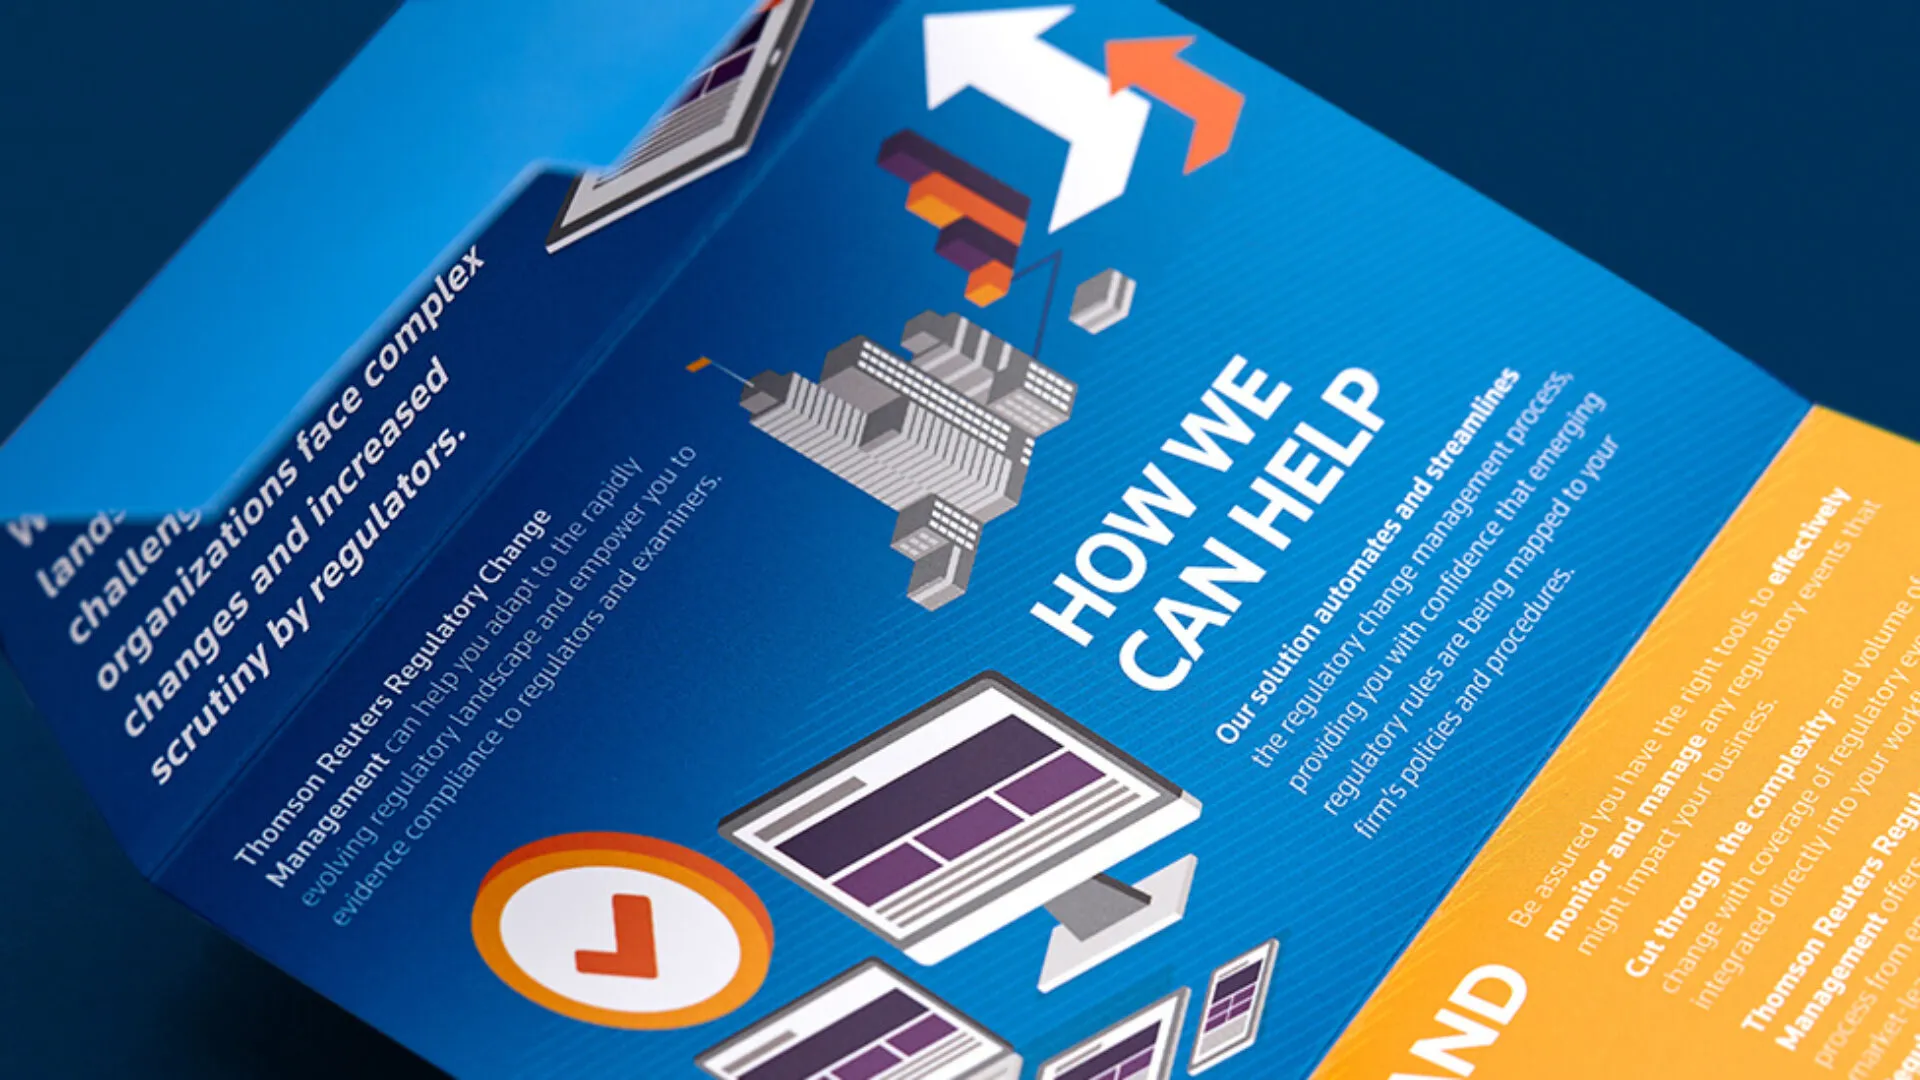
Thomson Reuters
Direct marketing design
What Our Clients Say About Working With Us
Here’s what some of our clients have to say about their experience working with us on their projects – from the clarity of the process and the creativity of the design, to how well the final outcome met their goals and connected with their audience.
OUR INFOGRAPHIC DESIGN PROCESS
We treat every infographic as a blend of strategy, content and design – and our process reflects that balance.
Discovery and Planning
We start by understanding your goals, audience and content. This phase may involve:
- Defining the purpose – e.g. to explain a process, visualise research, or support internal engagement.
- Clarifying the message hierarchy.
- Discussing the delivery format: digital, print, animation or all three.
Content Structuring
Strong infographics start with clear structure. We work with you to organise your content so it flows logically and connects with your audience. This may include:
- Grouping data points or steps into digestible segments.
- Identifying opportunities for storytelling or metaphor.
- Refining or developing copy to support visual clarity.
Creative Design
Our designers bring structure and energy to your content, transforming complex information into visuals that guide, inform and engage. Every element is crafted with intent – not just to reflect your brand, but to support the way your audience absorbs information. Design features may include:
- Bespoke icons and illustration styles that align with your messaging and tone.
- Colour-coding and visual hierarchy to aid navigation and comprehension.
- Modular, responsive layouts that suit both digital and print use.
- Consistent styling and brand alignment across campaigns and channels.
Review and Refinement
Infographics should be both accurate and engaging. We work closely with you to refine:
- Messaging hierarchy.
- Visual flow and legibility.
- Overall cohesion across campaign or comms materials.
Delivery and Adaptation
We supply your infographic as a high-res print-ready file, a digital asset for web or social media, or an animated version for extra engagement. We can also adapt it for different languages and cultural contexts to ensure it resonates with every audience.
Award-Winning Design, Proven Results
We’re proud to be recognised for our creativity, innovation, and dedication to great design. Over the years, Parker has won multiple awards that celebrate our passion for delivering impactful work – work that doesn’t just look great, but delivers real results. From increased engagement to boosted sales, our designs have helped clients achieve measurable success.
IFOA
Winner of ‘Best Annual Report’ category at the Memcom Excellence Awards.
Exodus
2nd place in the ‘Best Brochure’ and ‘Best Use of Content Marketing’ categories at the Travel Marketing Awards.
NHS
NICEtimes awarded silver in the prestigious CIPR PRide Awards for Internal Communications publication.
Exodus
62% uplift in sales, and an average 22% increase in website traffic YOY (year on year).
Noble Capital
“The American Government have been absolutely blown away by the quality of the document.”
Papa John’s
“Parker’s work is excellent and the responsiveness to accomplish the work in a record time has been superb. Thank you!”
Investing in Design That Delivers
Every infographic design project is unique, and so is the investment it requires. We work flexibly to suit different needs – from a single infographic to a coordinated series of visuals spanning multiple touchpoints. Whatever the scope, we guide you through a clear, transparent process to ensure the final infographics are not only visually engaging but also clear, informative, and impactful across every channel.
SPEAK TO OUR TEAM TO GET A QUOTE


More Infographic design projects
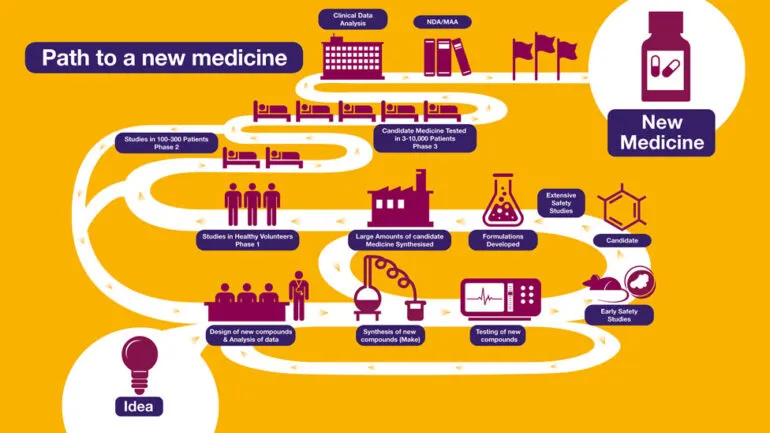
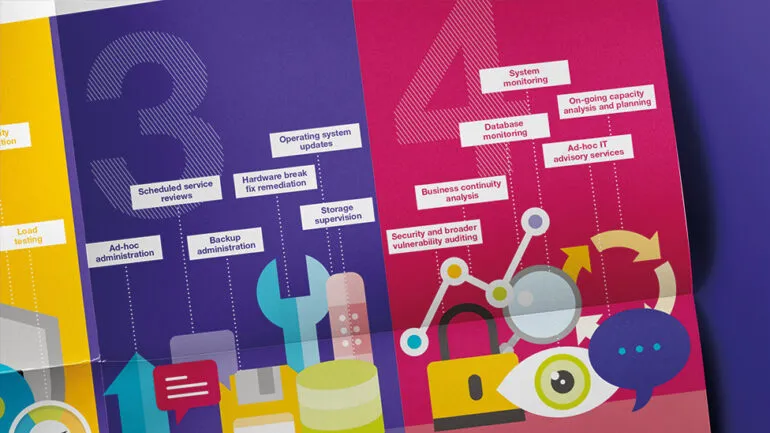
AstraZeneca
Process infographic
DAI
Collateral design
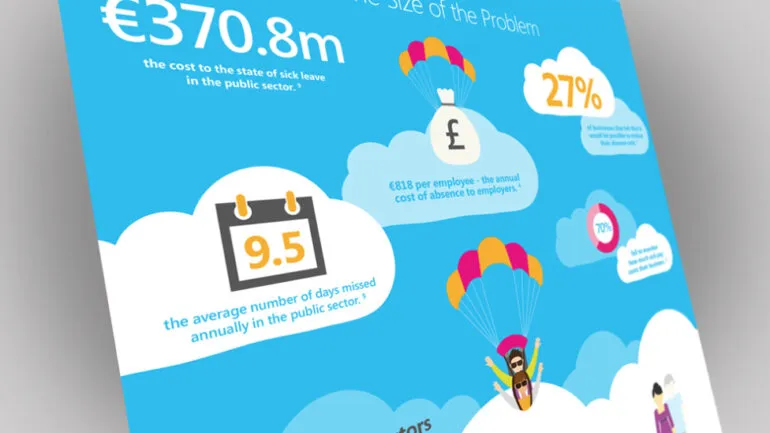
HRonline
HR infographic design
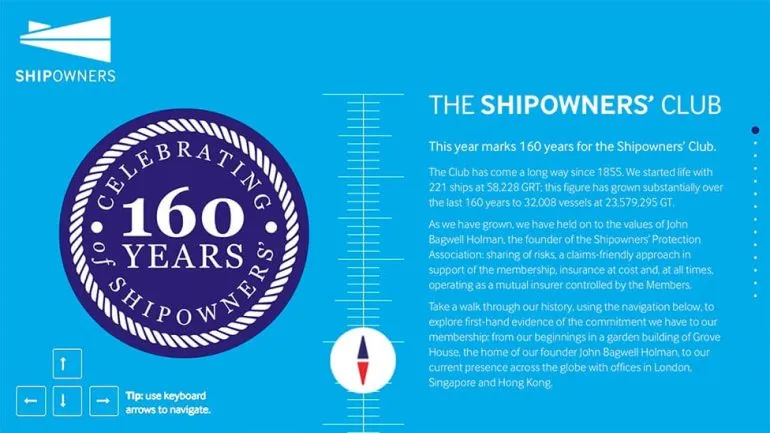
The Shipowners’ Club
Interactive infographic design
WHY YOU SHOULD CHOOSE US FOR INFOGRAPHIC DESIGN
EXPERTISE
Our team blends visual storytelling with communication strategy.
Versatility
We design infographics for everything from internal comms and training, to research insights, marketing campaigns and investor updates.
Innovation
From interactive ‘scrollytelling’ and animated explainer graphics to print-ready posters and shareable social tiles, we use the latest formats to make data and ideas come alive.
Trusted
We transform data into infographic design that informs, engages and drives action.
We’re an infographic design agency that gives you way more
If you’d like to discuss an infographic design project or get a quote, we’d love to hear from you.
