Amplifying the Impact of Deloitte's IT team

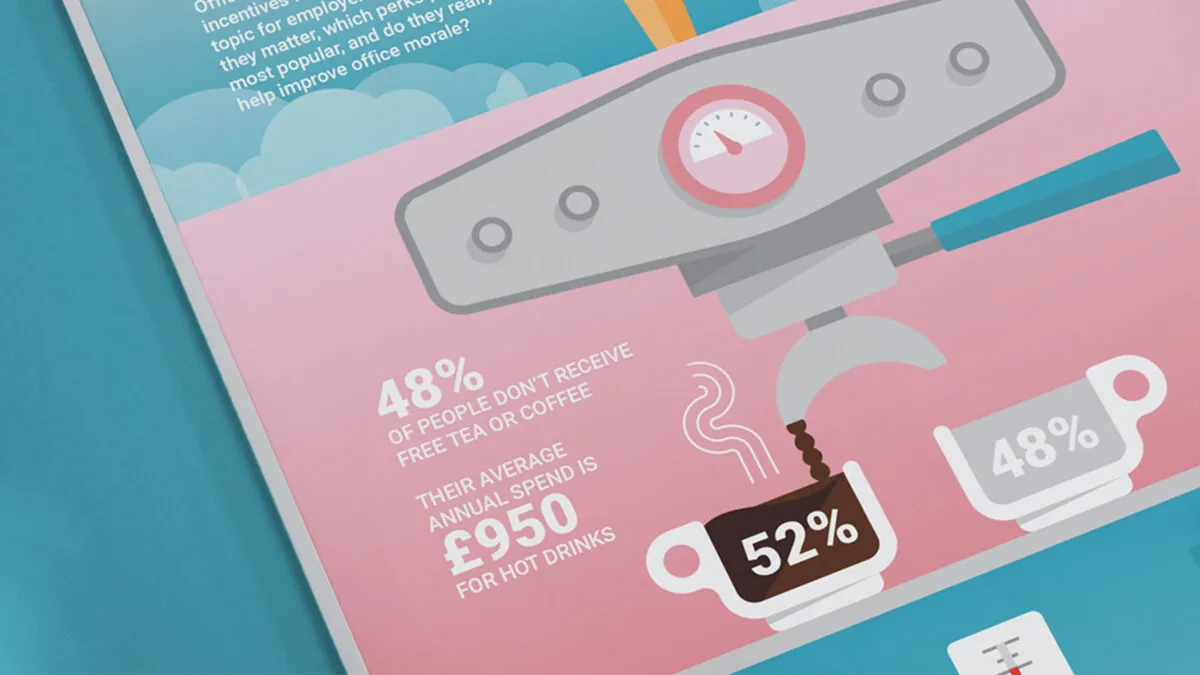
Transforming complex Pharmaceutical Information into Engaging Infographics

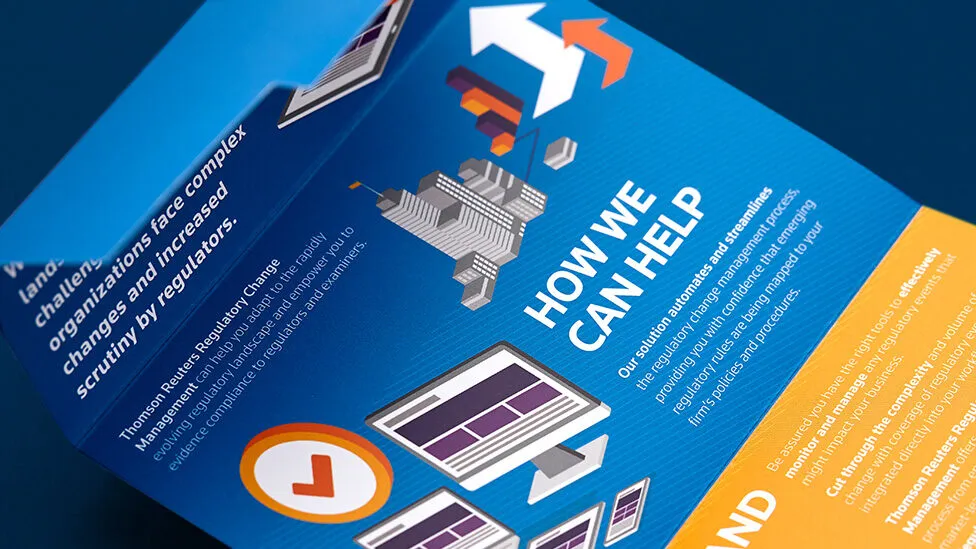
Creating a Visually Engaging Direct Marketing Piece for Thomson Reuters
Turning Data into a Compelling Visual Story for Social Media
Infographics
Turning data into engaging stories
We process images faster than text, and concepts communicated to us through pictures stay with us longer than anything we’ve read or heard. This makes infographics an extremely effective way to spread your message or make complex ideas easier to understand.
Through clever infographic design, we use layout, colours, illustration and typography to make your information memorable, shareable and engaging.
We use a range of infographic design techniques to effectively visualise your data. We’ve successfully developed infographics, ranging from scientific data to healthcare trends, to solve complex communication problems for our clients.
We can create your infographic from scratch, using experienced copywriters and designers to build a compelling story from your raw data, or work with your communications team to build visual solutions that align with your existing key messages.
Infographics AGENCY SHOWCASE
Infographic design is most effective when information, structure and visual language work together to support understanding and recall. The challenge is not simply presenting data, but shaping it into a narrative that people can quickly absorb and remember.
The case studies below show how we apply infographic design across different subjects and sectors, using visual thinking to help audiences engage with complex information and retain what matters most.

Deloitte
Internal communications infographic

Andrews Sykes Group
Social media infographic

ABPI
Pharma infographics

Kheiron Medical
Medical infographic design

Dematic
Ecommerce infographics

Thomson Reuters
Direct marketing design
What Our Clients Say About Working With Us
Here’s what some of our clients have to say about their experience working with us on their projects – from the clarity of the process and the creativity of the design, to how well the final outcome met their goals and connected with their audience.

“It’s always fun working with the team at Parker Design. I had a very clear vision for the look I wanted to achieve for this recruitment campaign and I’m delighted with the final assets. Thank you for the great service.”
Employer Branding and Recruitment Marketing Partner
AstraZeneca
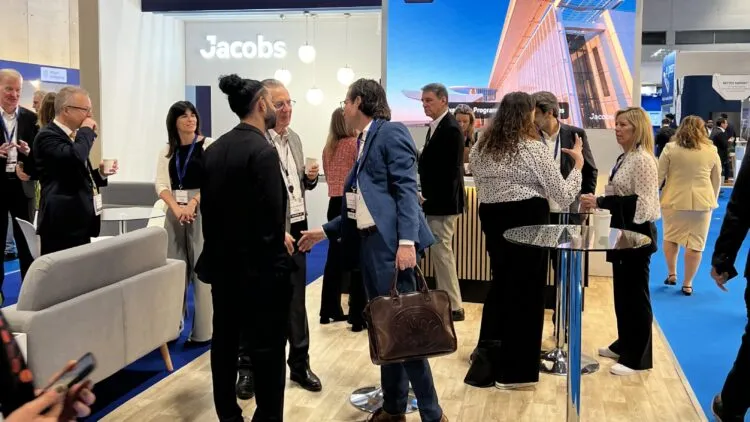
“Truly a superb experience working with you and your team and you made Passenger Terminal Expo a breeze this year! The booth was well thought-out and helping us achieve all that we wanted during the conference. Especially helpful was all the seating locations. We were able to have 4-5 different meetings going on at once. I know we have all factored in the necessity to work with you and your team again in Madrid next year! Thanks again!”
Americas Aviation Market Growth Lead
Jacobs
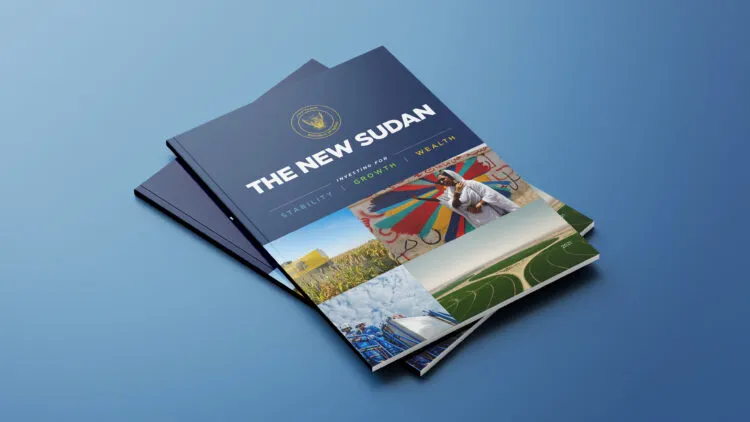
“The positive feedback we’ve received on the investment prospectus has been nothing short of overwhelming, in every sense of the word!! The American government have been absolutely blown away by the quality of the document, and just this morning we had a message from someone who’s been working in Sudan for over 20 years, and said the document was the single greatest presentation on Sudan that he had ever seen! So thank you very much again for all of your incredible efforts alongside us to bring it to fruition!”
Director
Noble Capital
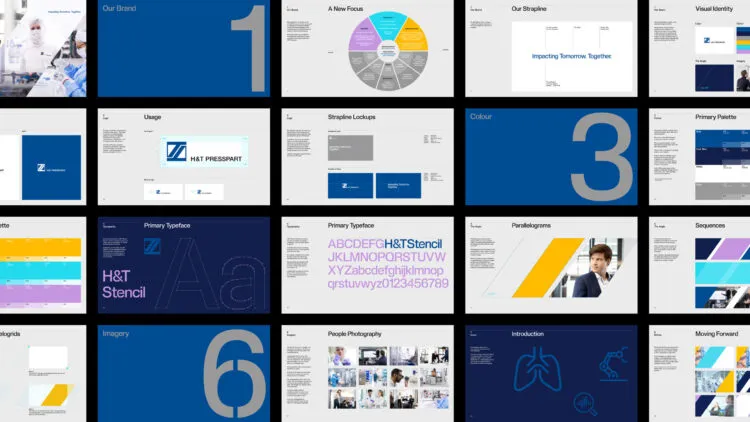
“We are on a long journey to turn Presspart from a component manufacturer to a device manufacturer and the team at Parker have been instrumental in supporting us in this journey with the brand work last year, and all the assets they continue to produce.”
Global Marketing Manager
H&T Presspart
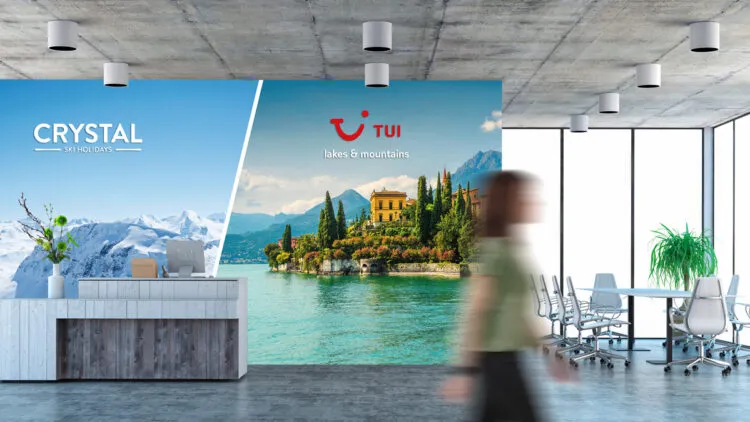
“The office branding looks fab, we’re really pleased with it and we’ve had really good comments from staff in the office over the last couple of days which is great. Thanks so much for your help on this. If we have any similar projects in the future we’ll definitely consider Parker Design.”
Brand and Campaigns Manager
TUI
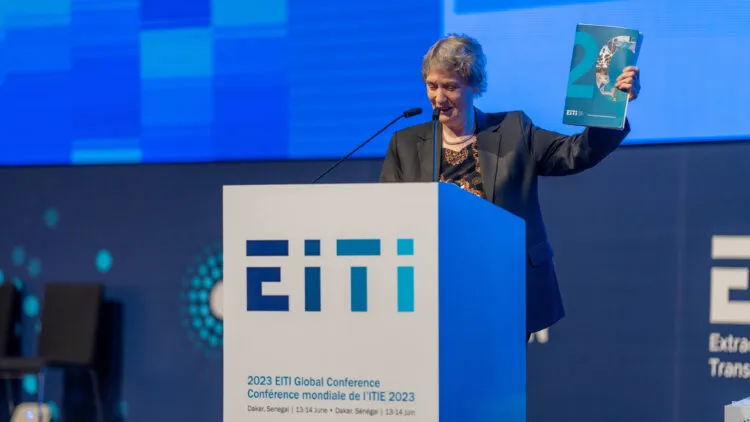
“Thank you for your amazing work with the report design. We are very pleased with the outcome and I feel it beautifully captures the spirit and tone of our brand. We especially appreciate your efficiency and availability to work on this project under such a tight timeline. It’s been an absolute pleasure working with Parker Design again. It’s been really fun! Thanks again for everything!”
Communications Officer
EITI
OUR infographics
PROCESS
Effective infographics combine insight, structure and visual storytelling. Our process is designed to help turn complex information into engaging visual narratives.
Discovery and Objectives
Every infographic begins with understanding what the information needs to achieve. At this stage, we work with you to establish:
- The purpose of the infographic, such as awareness, education or internal communication.
- The intended audience and their level of familiarity with the subject.
- The context in which the infographic will be used, including digital, print or presentation formats.
- Available data sources, content inputs and constraints.
Content and Narrative Structure
Before any visual design begins, we focus on structure and flow. This stage is about shaping information into a clear visual narrative, and may include:
- Reviewing and refining raw data or source material.
- Establishing a logical sequence for the information.
- Identifying key points, comparisons or takeaways that need emphasis.
Visual Concept and Style
With the narrative agreed, we develop the visual direction. This stage focuses on how the information will be expressed visually, including:
- Illustration style and visual language.
- Colour palettes and typographic approach.
- Layout structure and hierarchy.
Design Development
Once the concept is approved, the infographic is developed in full. This includes:
- Creating custom illustrations, charts and graphic elements.
- Applying consistent styling across all sections.
- Refining layout, spacing and balance to support readability and flow.
Review and Refinement
We work closely with you to review and refine the infographic. This stage allows for adjustments to:
- Content accuracy and emphasis.
- Visual balance and pacing.
- Overall tone and presentation.
Delivery and Application
After final approval, we prepare the infographic for its intended use. This may include:
- Exporting formats for digital, print or large-scale display.
- Creating alternative versions or cropped assets for social or presentations.
- Ensuring consistency across all outputs.
Award-Winning Design, Proven Results
We’re proud to be recognised for our creativity, innovation, and dedication to great design. Over the years, Parker has won multiple awards that celebrate our passion for delivering impactful work – work that doesn’t just look great, but delivers real results. From increased engagement to boosted sales, our designs have helped clients achieve measurable success.
IFOA
Winner of ‘Best Annual Report’ category at the Memcom Excellence Awards.
Exodus
2nd place in the ‘Best Brochure’ and ‘Best Use of Content Marketing’ categories at the Travel Marketing Awards.
NHS
NICEtimes awarded silver in the prestigious CIPR PRide Awards for Internal Communications publication.
Exodus
62% uplift in sales, and an average 22% increase in website traffic YOY (year on year).
Noble Capital
“The American Government have been absolutely blown away by the quality of the document.”
Papa John’s
“Parker’s work is excellent and the responsiveness to accomplish the work in a record time has been superb. Thank you!”
Investing in Design That Delivers
Infographics sit at the intersection of information, structure and visual communication. Each project is shaped by the nature of the data, the audience’s familiarity with the subject and the context in which the graphic will be used. The approach needs to respond to those factors rather than rely on a fixed visual style. We support that work through a considered, transparent way of working that helps ensure information is coherent, engaging and easy to retain.
SPEAK TO OUR TEAM TO GET A QUOTE

Infographic design projects

AMBS
Social media animation

Manchester Airports Group
Retail graphics
Kheiron Medical
Medical infographic design

AstraZeneca
Project infographic design

SPXFLOW
Organisational strategy infographic

HRonline
HR infographic design

Thomson Reuters
Direct marketing campaign

AstraZeneca
Process infographic

DAI
Business brochure

The Shipowners’ Club
Interactive infographic design

ABPI
Pharma infographics

N8 Research Partnership
Economic report design

Deloitte
Internal communications infographic

Noble Capital Group
Investment prospectus design

St George’s University Hospitals
Medical process infographic

Andrews Sykes Group
Animated infographic design


WHY YOU SHOULD CHOOSE US FOR Infographics
Insightful
We know how to identify what matters in complex information, helping clients focus on the points that will resonate most with their audience.
Methodical
Our approach is rooted in structure and logic, ensuring information is organised in a way that makes sense quickly and intuitively.
Judgement
We combine illustration, typography and layout with confidence, using visual language that supports understanding rather than decoration.
Dependable
Clients trust us to handle detailed, sensitive or technical information with care, accuracy and consistency across every output.
We’re an Infographics design agency that gives you way more…
If you’d like to discuss infographics or get a quote, we’d love to hear from you.